There are many ways to make one plot of band structure and DOS. We will choose 2 ways, one using a script and the the other using the sumo tool both based upon Pymatgen system. To install the Pymatgen systel click on the following link:
How to download and install the Pymatgen library
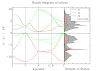
We will take of Silicon.We create a directory and we name it Si and we create 2 subdirectories bandes and dos. we put the following script in the directory Si and the input files of band and dos calculations in the related subdirectory. We need only the vasprun.xml of the 2 calculations and the KPOINTS file of the band calculation.
The input files
You can get the input files from the following link:
https://github.com/gVallverdu/bandstructureplots/tree/master/Si_bands
or
https://github.com/gVallverdu/bandstructureplots/archive/refs/heads/master.zip
Way 01: using script
Script bands_Si.py
You can get the script from the following link:
https://github.com/gVallverdu/bandstructureplots/blob/master/Si_bands/bands_Si.py
You need to remove the 2 first lines:
#!/usr/bin/env python
# -*- coding=utf-8 -*-
Plotting
We need to install plotly tool for plotting
(pymatgen) .../Si > pip install plotly # in case of problem try conda install plotly
After the calculation do the following:
(pymatgen) .../Si > chmod +x *.py
(pymatgen) .../Si > python bands_Si.py

way 02: using sumo tool
The sumo tool works also using the pymatgen interface. To install it we need to stay with the pytmatgen environment and doing the following:
(pymatgen) .../Si> pip install --user sumo
(pymatgen) .../Si> cd bandes
(pymatgen) .../Si/bandes> sumo-bandplot --dos ../dos/vasprun.xml --ymin -10 --ymax 10


0 Comments